ESRI UC 2019 Day 4
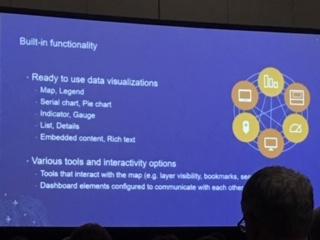
I started with a class about operations dashboard. They showed an interesting example of how it was used for superbowl security, and also by UPS and FedEx. There are 4 different ways to create a new dashboard. Dashboards can use maps bookmarks. You can create pie charts, but also manipulate the inner radius to create a donut. You can create hover labels. You can stack elements, create tabs, add pulse/pan actions (movements) connect charts to maps, can add filters to affect maps/charts, you can create your own url parameters, use dashboards in storymaps, and it now works on smartphones. Dashboards were purposely built for presentations. They are working on adding arcade, 3D capabilities, and layout improvements.


I went to a class on ArcGIS Monitor, but it was super boring and ridiculously expensive. And also their projector was SERIOUSLY wigging out, so I could not watch. It's 10k to start, and 12k to have ESRI staff spend 3 days setting it up on site and training you. However, it can monitor none ESRI databases as well, so there could be application in a large organization if they do not have a monitoring program that can monitor everything at once.
The vendor area was huge this year. They really forced us in there by hiding all of the pins in the showroom. Sigh. I hate going in and getting bombarded by salesmen. I just want the Map Girl/Map Woman/Map Ninja/whatever you're calling us now pin. That's it. I stopped by the bookstore to see if they were selling them, but sadly they were not.
 |
Unofficially, the numbers for this conference was just under 20,000 people registered from all over the world.


Check out the YouTube video here.
